


A Vancouver retailer emails a survey to its customer list and gets 300 responses back. The numbers looks strong: 62% say they would recommend the brand to a friend. Then someone puts that slide next to the sales chart, which has been declining for three quarters, and the meeting goes quiet.
The answer is sitting in the sample. Every one of those 300 people had bought something in the previous month, so the survey measured how the retailer’s happiest customers feel and said nothing about the people who had drifted away quietly. The number looked authoritative but it just wasn’t answering the business question.
Quantitative research is the structured collection and analysis of numerical data to measure patterns, test ideas, and support a decision with evidence instead of “only opinion”. The value of this method is asking the right questions to the right audience of people and reading the answer honestly.
What is quantitative research?
Quantitative research is a structured way of collecting and analysing numerical data to measure what people think, do, need or choose, and to find the patterns that can inform a broader business decision.
It’s a part of market research that puts a number on things: how big the market is, how satisfied customers are, which of two concepts wins, whether awareness moved since last year. The output is familiar to anyone who has sat through a results presentation. You can see percentages, averages, scores, segments, trend lines and comparisons between groups.
One distinction is important here. A number is a fact about the people who answered your question. It only becomes a fact about the whole market when the study design and the sample can carry that weight, and as in the previous example, 300 recent purchasers can tell you a great deal about recent purchasers but nothing at all about the customers you lost last quarter.
In plain language: Quantitative research is the part of market research that puts a number on the opportunity, the problem, or the behaviour. It tells you how many, how much, how often, and how different one group is from another.
Quantitative vs. qualitative research: the what and the why
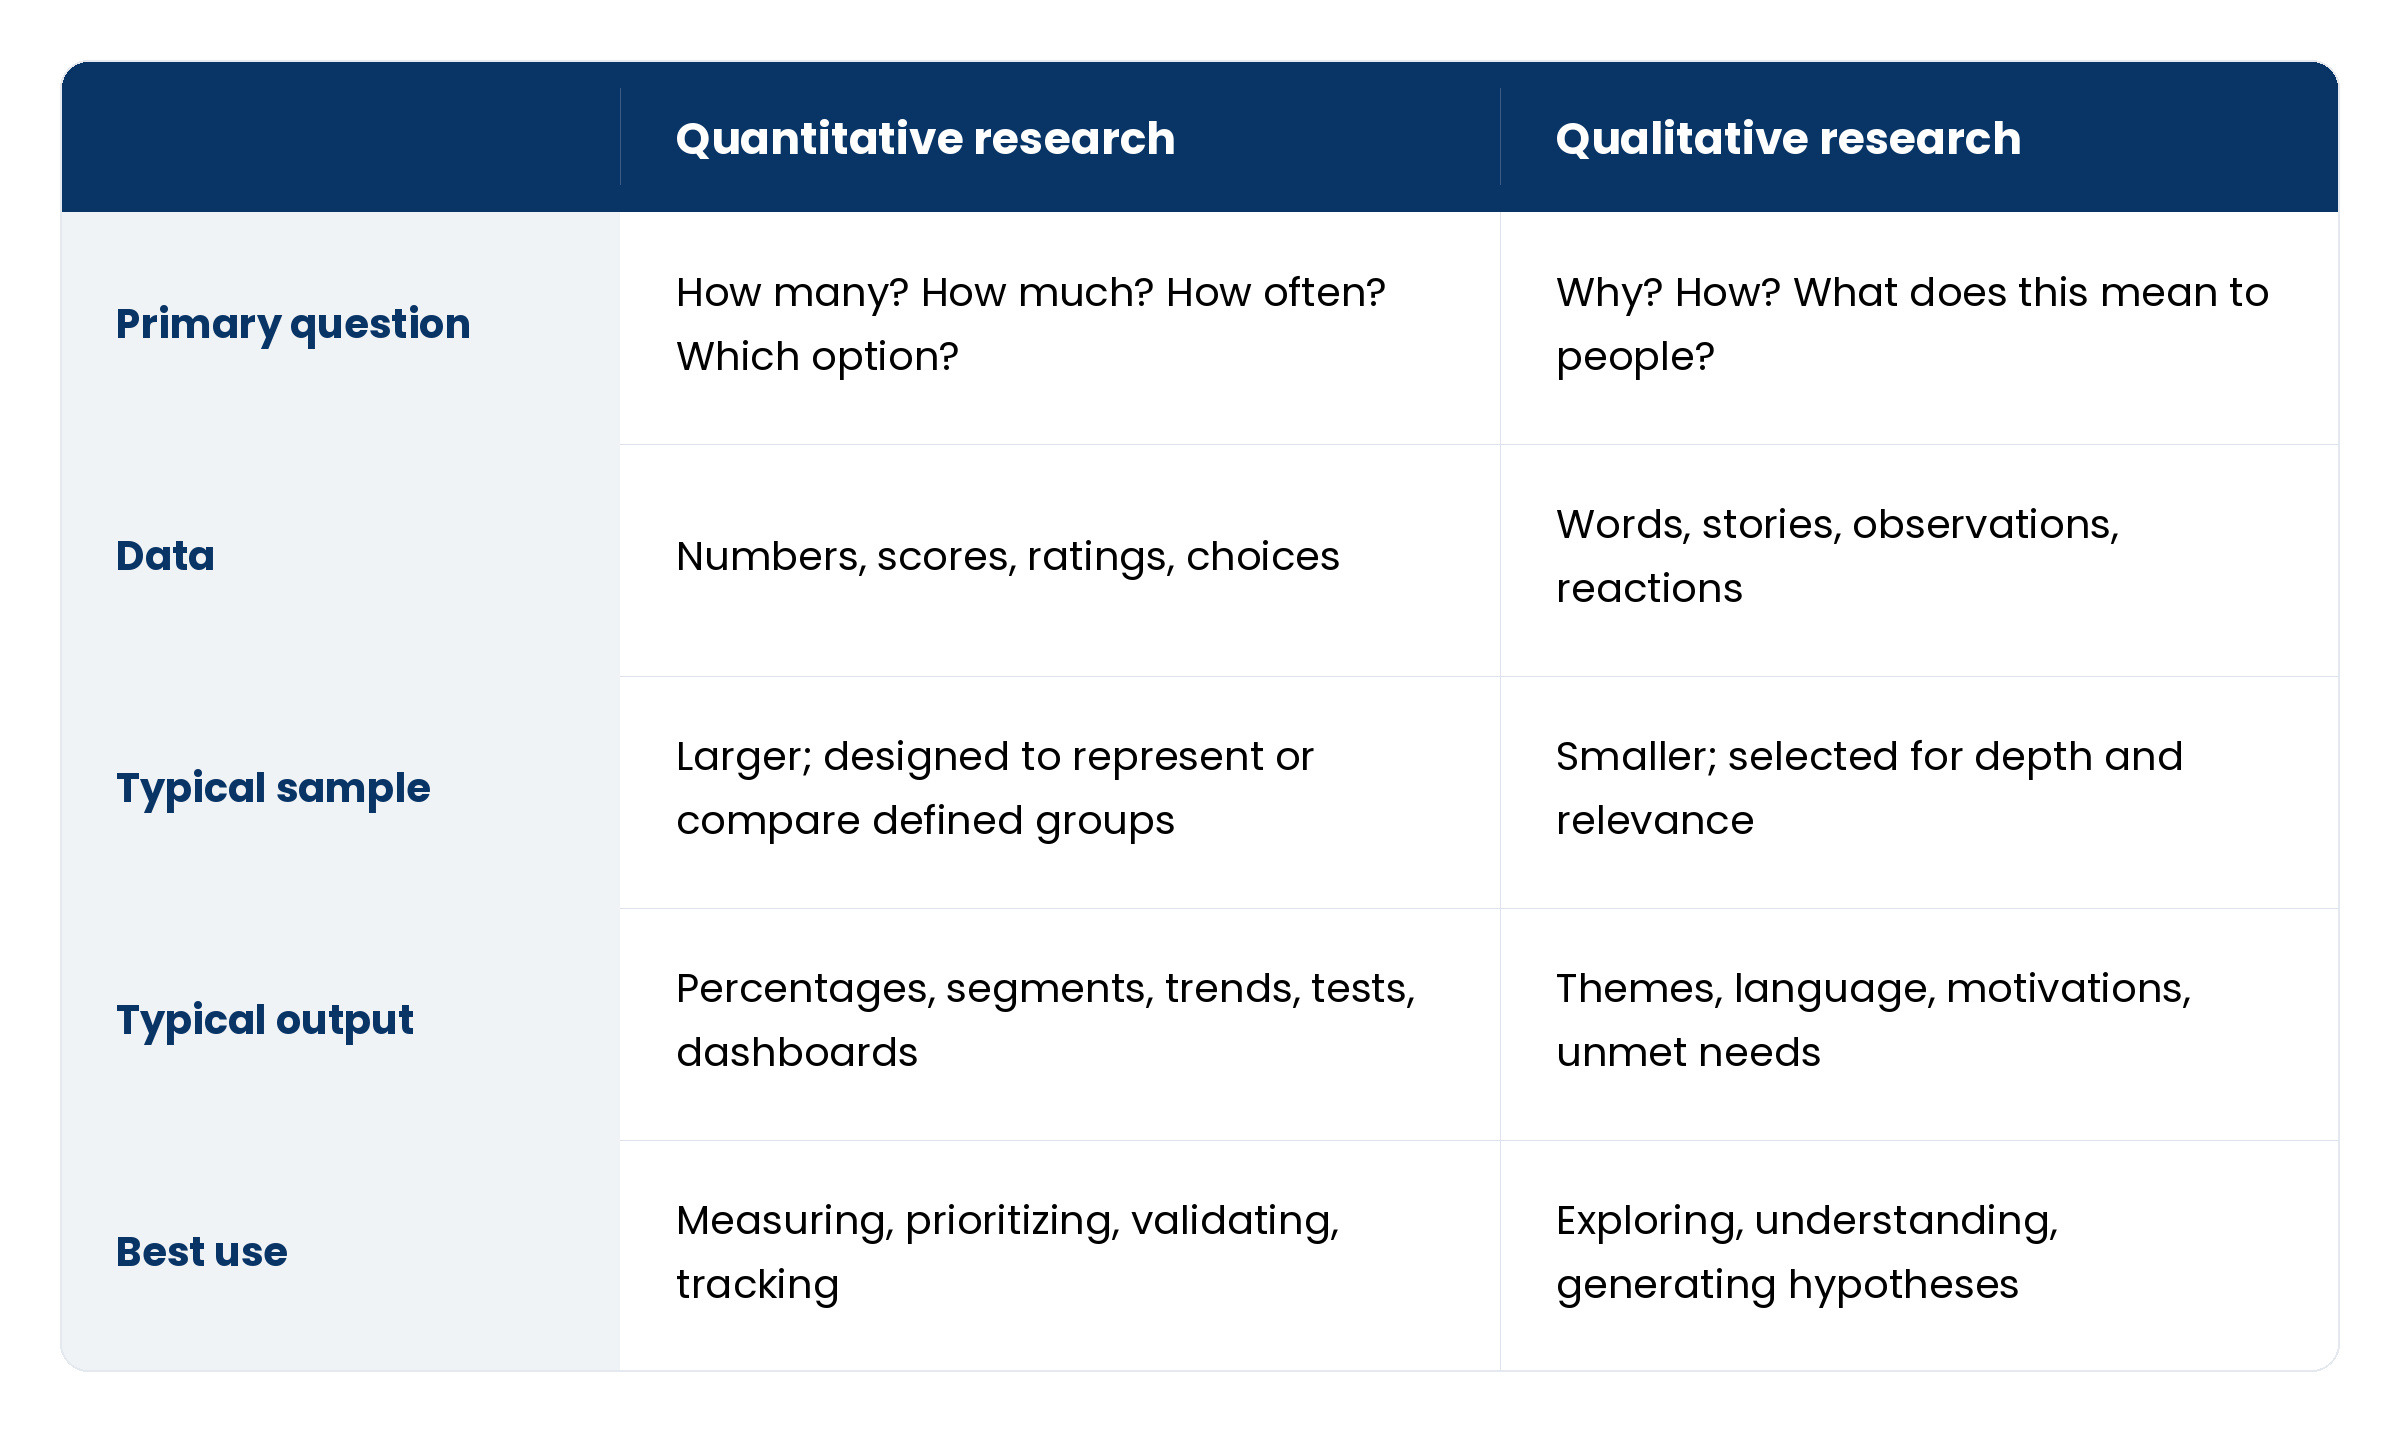
Quantitative research measures scale and pattern. Qualitative research explores meaning, motivation and context, but cannot give you a statistic you can rely on.
On the same business question, a survey can show that 38% of trial customers never make a second purchase, and a round of interviews can show what went wrong for them during their first order (i.e., the reason they won’t make a second purchase)
Neither is the better method. The right one depends on what you need to decide and many studies use both in sequence: for example, interviews first to discover the language customers use and the barriers they hit, then a survey to find out how widespread those findings are. It can run the other way too. A tracker spots a dip and interviews explain it. Our guide to qualitative research covers that side of the pairing in full.
Common quantitative research methods
The designs describe the logic of a study. The methods below are how quantitative data collection actually gets done, and many projects need a combination of more than one.
Online surveys and questionnaires
Closed-ended questions like rating scales, multiple choice, ranked lists produce answers that can be counted and compared across every respondent. It is very straightforward so most modern survey research methods can reach a representative sample within days or a few weeks.
Experiments and A/B tests
If you want to see the effectiveness of two prices, two messages or two checkout flows, that’s the method to employ. You show two options to comparable groups so the only difference is the thing you changed. The same logic applies to concept and pricing tests run through a survey.
Structured observation
This is a method of counting behaviour against a consistent framework instead of asking about it. How many visitors stop at a display? How many shoppers who start a checkout finish it? These are some examples.
The gap between what people say they do and what they actually do is wider than most of us would like to admit.
Secondary data analysis
You can also work with data that already exists: CRM records, transaction history, Statistics Canada tables or earlier waves of your own survey. It’s the most cost-efficient method on this list but with one condition. Data collected for one purpose is often a poor fit for another purpose, so you should be careful.
Trackers and recurring studies
This method asks the same questions at regular intervals to measure change in brand health, customer experience or market perception. A single survey tells you where you stand but a tracker tells you which direction you are moving.
The data quality checkpoint. Before treating a result as decision-ready, ask four questions:
- Did we ask the right question?
- Did we reach the right people?
- Did we remove low-quality or inconsistent responses?
- Are we looking at a meaningful difference or is it just noise?
Another problem is where sample size gets mistaken for sample quality. A survey of 2,000 people can still be wrong if the questions led respondents towards a specific answer, if the sample skews to one province or language group, or if a share of responses came from people clicking through as fast as possible to collect an incentive. National averages, for example, can hide real differences between Quebec and Alberta. None of these problems announce themselves on a dashboard. Sample quality has to be built into the design, the fieldwork and the analysis from the start. It is too late to add at the end.
Reliable decisions start with reliable data. Our Data Quality Optimizer is how we screen survey responses for exactly these problems before a result gets anywhere near an important business decision.
Quantitative research examples in business
Four example situations where a study can change a real choice.
A BC consumer brand had three packaging directions and one shelf. Rather than let the loudest voice in the executive room pick, they tested all three with a representative sample of its target buyers and measured purchase intent. One direction won clearly, and the study also showed why the weakest one lost confidence with buyers over 45. It was a risk the internal team had never considered.
A service business wanted to know where retention risk was hiding. It measured satisfaction and renewal intent across customer segments, then looked at which touchpoints moved with renewal. Onboarding mattered far more than support response time, and that finding reversed where the next quarter’s budget went.
A growing company surveyed its broad market to see whether “our customers” was really one group or several. It was several, each with different needs and buying triggers and that segmentation became the map for targeting. They created three campaigns that each spoke to somebody specific, instead of one that spoke to no one in particular.
A product team couldn’t agree on price, so it showed alternative value propositions and price points to comparable groups of buyers and measured the response. The option that matched demand was neither the cheapest nor the founder’s favourite.
In all four cases the method was useful because it helped choose between real options with confidence.
When should a business use quantitative research?
Use quantitative market research when the decision depends on measurement like how big an issue is, how common or how much it’s worth. It’s also the right tool for structured comparison, whether that’s two concepts or three messages. And when a finding has to hold beyond a handful of conversations before anyone will act on it, a survey earns its place.
At Bondar Group, the first question we ask a new client is what decision they’re trying to make. Whether that calls for a survey, interviews or both comes second, and every choice about the study (design, sample, questionnaire, size) follows from the answer. It’s also why we’ll never suggest a bigger study than your objective needs.
Weighing a survey vs. a qualitative study (or both) for a live business question? Our senior researchers can help you design the right one, and we’ll say so plainly if a survey isn’t it.
Frequently asked questions
What is a simple example of quantitative research?
A customer survey asking 500 target buyers to rate their satisfaction on a scale. The answers can be summarised as averages and percentages and compared between groups, for example new customers vs. long-standing ones.
What are the main methods of quantitative research?
Surveys, experiments or A/B tests, structured observation, and analysis of existing numerical data such as transaction records or public datasets. Most business studies lean on surveys, with one of the others added when the question calls for it.
How is quantitative research different from qualitative research?
Quantitative research uses numbers to measure patterns and scale. Qualitative research uses conversations and observation to understand motivation, context, and meaning. Many projects combine both.
How many people do I need for quantitative research?
There is no universal number, and anyone who quotes one before hearing your business question is just guessing. The right sample depends on the population you need to understand, the groups and subgroups you need to compare, and finding a high standard margin of error. A good research partner justifies the sample plan before fieldwork starts; our guide on how to choose a market research firm covers what that should look like.
The takeaway
Quantitative research gives you a way to move from opinion to evidence like measuring your market, testing your options, and finding the patterns that should change what you do next.
The number is only worth trusting when the study behind it was designed with care, fielded properly, and read by experienced people who understand the decision it’s meant to support. That’s the standard we hold ourselves to at Bondar Group, and it’s what quantitative research in Canada should look like: senior-led work with no hand-offs, quality controls built into every stage and insights written for a real decision rather than a slide library or a fancy report template that has already been used for 10 other projects. If you’re starting smaller, our guide to market research for small businesses shows what’s achievable on a tight budget.
Ready to turn uncertainty into evidence you can act on? Let’s talk about your next project.